Wonk Wednesday: Twitter’s Analytics Dashboard
 Twitter, at face value, is a 140-character micro-blogging platform vastly used by content producers and news media (among other industries). But we like to dive a little deeper; and we believe there’s a level of insight that can be gleaned from the platform’s analytics dashboard. We find that a lot of clients understand how to use Twitter, but are perplexed on how to measure its effectiveness, grow audiences or improve its strategy. For this week’s installment of Wonk Wednesday, we are offering you three ways to use the Dashboard so you can do those things!
Accessing the Dashboard
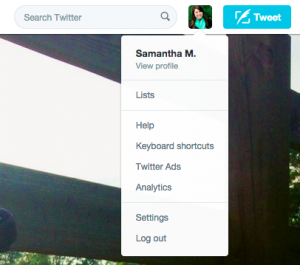
First thing’s first… accessing the Analytics Dashboard hasn’t always been easy to find; but with the dashboard’s new launch, it can be found by clicking the profile picture on the top right menu bar (on a full-site version of Twitter). A drop-down menu and a click on “Analytics” will make the dashboard magically appear!
1. Dashboard – Quick Look
Twitter recently relaunched its dashboard that identifies a monthly overview of top tweets, impressions, mentions and followers. Regardless of brand or personal use, the dashboard gives a user a quick glance at what kind of content performs the best, and allows for month-to-month benchmark measurement. Pro Tip: If you have to provide reports to your boss or a board, this is a great overview to screen shot for use.
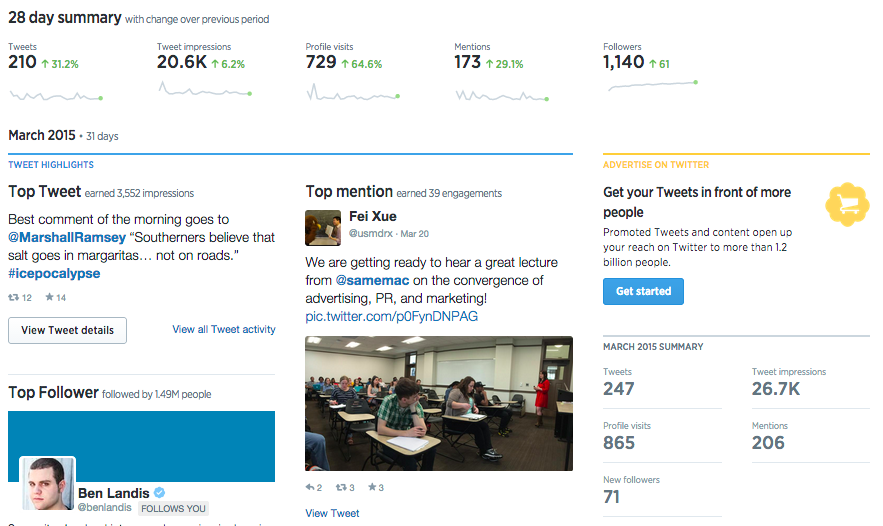
Twitter Analytics Dashboard
2. Engagement Metrics
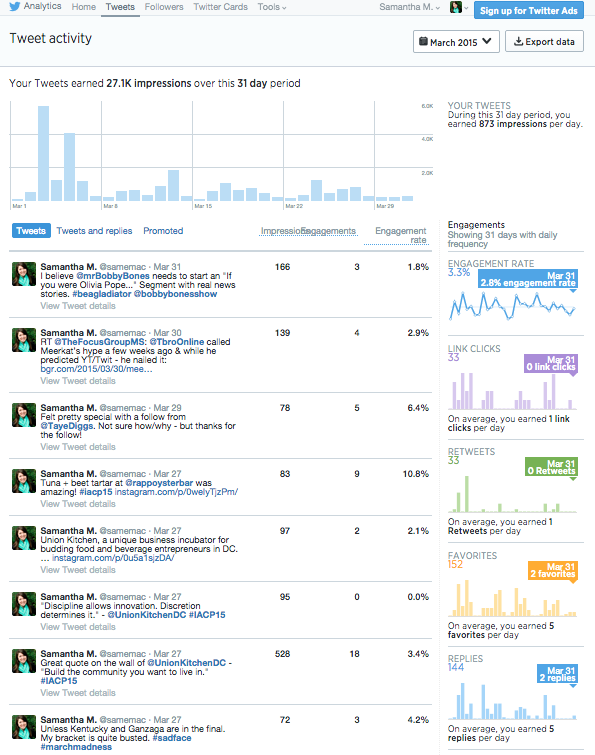
Twitter Analytics Dashboard: Tweets
At the top of the Dashboard, you can access more in-depth information about all tweets for a time period by clicking on the “Tweets” link. Here, you can toggle between three categories: tweets; tweets and replies; and promoted tweets. Each has engagements broken down into three columns: impressions (how many individual eyeballs saw your tweet), engagements (how many people interacted with your tweet), and the engagement rate (ratio of eyeballs to interaction). While there are MANY variables that play into why a tweet sees higher eyes than others (like timing for instance), these are three great metrics to benchmark for improvement. Want to track trends that will improve your strategy? Take a month of data, marking each tweet as information dissemination, conversation and with or without media. Then look at each of the three columns. What has higher numbers? Easily, you will be able to see a trend of what works with your specific audience. Remember, being witty and conversational wins!
3. Followers – Interests & Gender
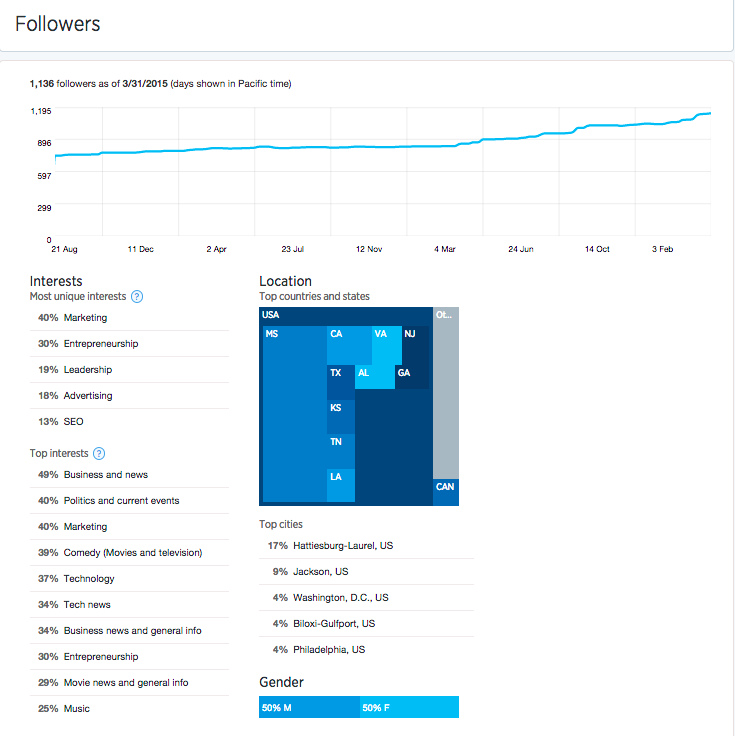
Twitter Analytics Dashboard: Followers
Just like you accessed the tweet metrics, you can also look at the demographics and sociographics of your followers by clicking on the link “Followers.” This feature provides a detailed look at the dynamic of your audience base via three very specific variables: interests, gender and location. You can also track growth via this feature. If you look at my current followers’ interests, you’ll see very quickly that my Twitter feed is widely focused on the marketing, advertising and public relations fields. This means that 80% of the content I post is geared toward this industry. If I were to begin tweeting about the food industry, I might find my tweets have poor engagement.
This feature also allows you to see, graphically, location and gender splits for your audience. Knowing who your audience is, and where they are located, is invaluable. If you are a nonprofit organization in the public service format, and a majority of your audience has interest in the food industry – you may need to work a little harder at growing your audience with industry-quality follows.
While a very high-level look at the Analytics Dashboard for Twitter – these three components can help with creating a master Twitter plan or social strategy. We often tell our clients to dive into the numbers with stakeholders to determine what variables are most important to the life of your organization. Once you know “what” to measure, you’ll have an easier time measuring it!
Samantha McCain
PR & Content Manager
